Attending a great event today, presented by Platt Retail Institute.
A lot of talk about how consumers are being engaged, and how to we do even better.
How do we measure tears? Emotional responses to IoT, interactions.
More to follow.
-That Planning Guy, on location!
ROI- Retail Orphan Initiative
I took part in the ROI event this year in NY at the NRF conference. I can only say that I was truly proud to be a part of the great day for the great cause.
I ran across this in RIS this week: RIS ROI Article
All I can say is THANK YOU to Darren Singer and Shopko Stores for showing what caring looks like.
—
As SVP of Retail Health & Wellness for Shopko Stores, my mission is to improve the quality of life for the patients and families in the communities we serve. Joining the Retail Orphan Initiative and my compatriots in our industry in this righteous cause of caring for orphans and foster kids is aligned to this goal. This cause resonates with me as a father and a citizen of the world. I hope it does you as well.
For this reason, I am issuing a donation challenge to like-minded retailers and partners to join RetailROI make a difference. I have donated $1,000 and challenge my friends and colleagues in the industry to donate as well. $1,000 to RetailROI this month means 50 special needs orphans can move from an impersonal orphanage into a loving foster home.
Whether you are participating in March Gladness or simply want to make a donation, I urge you to get involved. You can donate here. 100% of the money raised after payment fees goes to help these children. Will you please join me?
Together we can make a HUGE Difference.
Darren Singer
SVP Retail Health and Wellness
Shopko Stores
The Retail Orphan Initiative is grassroots charity made up of retailers, vendors and partners in the Retail/Hospitality Industry to leverage our skills, networks and companies to make a real difference for orphans and vulnerable children in the US and around the world. Inspired by the work of the late Paul Singer (CIO of Target and SuperValu), RetailROI has helped over 180,000 children with clean water, schools, computer labs and business training in the last seven years. Please get involved. More information is available atwww.retailroi.org.
Demand Forecasting and Weight Loss
Asked: “Can you project jacket orders for this fall/winter”? SURE, says That Planning Guy. Innocuous enough request, right? We all know from Replenishment 101 (click here) that Need = Demand () – OH – OO. We have no on order, as we are well in pre-season. We do have carryover product, so we just need to know demand, right? We have years of history, myriads of like-items, plenty of data points to draw conclusions from. OK, #datanerds: GO!
Slight detour in the story, but I swear it will come back around…I am actively working on losing weight. Trying to be ‘That Skinny Planning Guy’, yeah right. I go to the gym every day, I monitor what I eat fanatically, and I understand the very simple math of calories in – calories out = calories deficit; 3500 calorie deficit= 1 lb lost fat! WOO! Easy! Simply burn more than you consume, and every 3500 deficit, the scale rewards you. What can be easier? So— if I eat 2000 calories and burn 3000 calories every day, I should lose 1 pound every 3.5 days, or 2 lbs a week. Just like clockwork. Right?
First, let’s validate the dataset. Calories in. For lunch I had a sandwich which said 400 calories on the label, and a salad which I estimated about 300. But is 700 EXACT???? Not even close. The 400 calorie sandwich had no mayo . I took the cheese off. I added mustard. I am not weighing a salad. I have no idea exactly to the gram how much dressing. So 700 is an estimate- at best. My apple has 80 calories. Do I have to eat all of it? Core and all? I am not a horse! What if it’s a really big apple??? The right side, calories out, is even more vague. I went to the gym. Regular readers won’t be surprised that I have a heart rate monitor and an app on the phone that tracks calories EXACTLY (#gymnerd) with an EKG accurate HR monitor, age, weight, height, sex = calories burned. Precise? I doubt it. My resting (basal) metabolism burns 100 calories an hour- so says an article on Wikipedia, so that has to be right. At the gym I burned 500 calories in the hour. HARD work. Is that incremental? Or inclusive? And if incremental, is the 100/hour even close or just a big estimate again based on age, weight height, etc.
The point of all this is that none of this is an exact science. But over an extended period of time, the math should be CLOSE. Will I lose EXACTLY 2 pounds this week? Doubt it. Will I lose 20 over 10 weeks if I keep this up diligently? VERY likely. Time makes fluctuations over a curve smoother.
What does that have to do with a jacket projection? Short term precision is nearly impossible, but being right over the time period is what matters most.
We need to have jackets on the floor when it gets colder. It’s March now, so predicting when the weather in Vegas will get cooler is easy. Should occur sometime between late August and ‘it won’t get cold at all this year’. We had a 45 degree swing in daily high this week! If I could predict the weather with precision, you’d be reading ‘That Clairvoyant Guy’ website right now. All I can tell is that it’s going to get hot, soon.
Factor #2- predict the weather for WHERE? We sell a good amount of jackets in February and March because it is cold where people are from, not necessarily here. It is still snowing on some of you right now. In Vegas, our customer base is truly the entire world- so predict the weather globally.
Factor #3- internal weather. When it’s cold out or hot out, inside your glorious resort is perfectly comfortable. People can come for a visit at several wonderful resorts and really never go outside at all. Wake up to room service breakfast. Go work out at gym. Have a Spa treatment, massage. Go have lunch. Take in a little afternoon shopping, an afternoon nap. Have an early supper and see an award-winning show. Then do a little gaming after the show before heading to bed. All that without ever leaving the building. That’s a pretty perfect Vegas day! But, If 74 degrees is a little chilly for your tastes, you may need a sweater or a light coat- even though its July and 117 out.
Factor #4: Sizing. Last year, we sold jackets in a perfect 1-2-2-2-1 bell curve, S-2XL. But is that because that’s what we had on the floor? If we had no mediums, that effects sales of L. So what we bought = what we sold. Should we look at size sales for the first few weeks of selling? But was that indicative of the full season? Maybe we should follow S/O rate by style/color/size and of course by location, as the demographics in each location are so widely different.
Simple request, once you factor in global weather, internal thermostat strategy by resort, consumer demand, and the actual size of the potential customers. And we didn’t even talk about color.
None of this is an exact science, but if we factor in all the ‘knowns’ and make educated, data-driven assumptions on the unknowns, time will smooth out the curve, and we will sell a lot of jackets.
-THAT Planning Guy
Pricing Elasticity 101
Price elasticity is a wonderful equation. When you Google it, you get a lot of equations that look like this:

Isn’t that the writing they found at Roswell, New Mexico on the Alien ships? I am also fairly sure I went to a party during my younger days at a house that had many of those symbols over the door. But that’s a different story.
To be honest, I think that might be way over complicating the simple idea of elasticity.
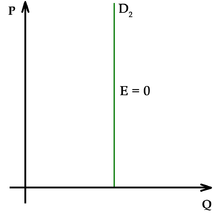
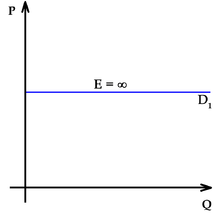
So much easier to think of it this way— if you think of elasticity in between these 2 graphs, all pricing should fall in there somewhere.
The simple math is if the price increase and unit fall behave in lockstep (or worse, units fall disproportionately to the price change), that’s elastic. If the the units fall less than the price increase, that’s inelastic. And that’s where the money lies.
Identifying these items is often difficult, as some degree of what-if has to take place. But in a perfect scenario and all other factors being equal, if you raise price and units don’t fall (inelastic) then you make more profit. If you raise prices and the unit fall % is greater than the increase in profit kept, your elasticity was too high, and you lost money.
The math is easy; the execution is what is actually much harder. Consumer behavior is a fickle science, and small ripples cans make large waves. If the consumers feel the price is too high for the situation (whatever that may be) they will not shop. This applies to a grocery store, a web site, any transaction-based environment.
My concern is if the unit loss leads to intangible losses: What are the ‘pull items’ from a basket analysis that also may fall, with the law of unintended consequences rearing its ugly head. If you raise cigarettes, and you gain extra money but lose units, and the change proves to be inelastic, that’s great! Units fell 2%, and transactions fell 2% but revenue and profit up 5%. BUT- before you pat yourself, what about the sales WITH the cigarettes- Lighters? Gum/mints? Any change to behavior in these? Whats the avg UPT of a transaction involving the item. If the add-on item is not impacted greatly, or the net is still positive, that’s a winner. The point is to look outside the box to be sure you are right and not just do analysis in a vacuum. If the results of the total store, and the total transactions, and the total profit is increased, then the move was genius. Someone once said “Analytics Drives Business.” Enjoy the fruits of this! And then find the next inelastic item to glean profit from. They are out there, filling your shelves, your website, your stock rooms.
Too low, too high, Goldilocks pricing?
Retail is an imperfect circle. Remember your 3 R’s- Right product, Right time, Right price- and all 3 factors are critical. A great product late is no better than a bad product, and a incorrectly priced item negates the first 2 every time.
-THAT Planning Guy
by
Monday Morning
What does that conjure up in your head? Dread? Oh God another Monday… What will be waiting for me today….
WRONG. A whole new set of data to tear into. Truths to be uncovered. Answers to be revealed, and business to be driven.
Anyone can fix a problem in hindsight. What separates the winners from the losers is fixing it in real time, or near real time.
Identify. Analyze. React. Repeat.
I challenge all my Data Nerd brethren to BRING IT on a Monday.
#analyticsdrivesbusiness
-THAT Planning Guy
Weekend Update
A few things to comment for the weekend:
This week, in the same day, I said something was as ‘goofy as a left-handed join’. (if you don’t get that reference you may be on the wrong site) I also commented “Yo Dre, I got something to say”
I quoted Ice Cube and a SQL command in the same day. It was THAT kind of day.
In the coming weeks, I will have a lot of things to say about BI and big data ‘tools. ‘ What does data mining look like? SHOULD it be easy?
I am thinking about the update to Replenishment 101 (201?) Where to go from simple? Complex!
Also, want to explore the pre/in/post season analytics: Living in 3 seasons at the same time.
Last, soon I want to look into size/color analysis: Best practice? Timing? Whats the best time to dig in the dirt to find the answwer?
“Somewhere squatteth the toad of truth. ”
Stay tuned!
-THAT Planning Guy
PS- for my #datanerds:
SELECT *
FROM table–name1 LEFT JOIN table–name2
ON column–name1 = column–name2
WHERE condition
Retail Bankruptcies
As Sports Authority knuckles under, I am taking pause to reflect on the 10 biggest Retail BK’s of all time, as written in this article from Fortune: Fortune Article Link
In order of assets at time of BK:
Circuit City, Linens & Things, General Atlantic & Pacific Tea (A&P),Radio Shack, Blockbuster, Borders, Sports Authority, Sbarro, Friedman’s, Brookstone.
Ruling out Sbarro, as it really is a restaurant chain and not a traditional retailer, and Friedman’s, which is a jewelry store that I am simply not familiar with, what stands out to me is these were ALL very top or near-top of their category businesses at one point.
Circuit City was very similar to Best Buy in product and pricing. Linens&Things was sort of a small version of Bed Bath and Beyond (less Beyond, more Bed)
A&P was not just a large grocer: They had 16,000 stores in 1930– and were the largest retailer in the WORLD. (and 150+year history)
Radio Shack? Was a premier player in the PC market at the beginning- remember the TRS-80? Then you are old also. Founded in 1921, so managed to survive a few wars the Depression, and every other world-changing event for nearly a century.
Blockbuster didn’t invent the movie rental concept- but they certainly made it simple, accessible, and EVERYWHERE.
Borders? Put it next to a B&N and heck if I knew which was which.
Brookstone was the store that was FUN in the mall!
So what did these stores fail in while their rivals are still alive? Obviously a lot of reasons but the one that struck me as likely (in hindsight) was failing to adapt-or-die.
If Blockbuster had opened an online delivery, maybe they’d be Netflix.
If Radio Shack and Circuit City had figured out whatever it was that made Best Buy work, and opened enough online presence to compete with Amazon? Maybe a different story.
Radio Shack alone could have been a MONSTER- Introducing a home PC in 1977, for $600? About the same time as that other computer maker startup, and that one turned out OK in the end.
What did B&N do better than Borders? I don’t know, but clearly neither did Borders. I think they were both late to the online book situation, but obviously B&N survived. Adapted.
And A&P? Well that’s the scariest of all. How do you completely own a market and lose the entire company in a few decades? Obviously competition changed. The landscape changed. Bad decisions must have been made. But to have that kind of economy of scale and lose it is just a terrifying prospect for a lot of today’s market leaders.
If you don’t remember what got you there, it is hard to stay there, I think. 16,000 stores, 85 years ago. That’s over 4000 more than Walmart has today. In 30 years, will a change in landscape not only over-through Walmart, but literally end them? Hard to fathom… but I bet A&P management in 1930 felt the same invincibility.
So today, lets all say a retail prayer for the staff of Sports Authority who likely lost a lot of jobs, and hope they can come through the other side leaner, smarter, stronger, and better able to compete. We are all retail brothers.
Note: Brookstone emerged from BK in 2014 and has continued operations, which is a joy for anyone who is at the mall and wants a chair massage!
Plan, execute, and analyze. Repeat. And never stop. Never.
-That Planning Guy
Great Service
What makes for great service? Yesterday I ranted about Starbucks… Today I went to my usual Starbucks and did my usual mobile order. When I arrived, one of the ladies saw me, walked over and handed me my coffee (with a green stopper thing !) “Here you go Steve”. Super friendly smile and all. And the coffee was exactly as I ordered, of course. Mobile ordering is a godsend.
If that happened every day, I would consider that GREAT service.
Is Good service, delivered consistently, the same as Great service? I believe so.
When we ‘deliver’ a report (flash for a manager, sales by item for a stock host to replenish a floor, WOS with orders needed already calculated to a buyer, etc. ) and it comes as expected, on time, and accurate, is that great service?
If you miss a day, or the service level drops for a day ( report server failure, or no one made my coffee! ) the exception makes for bad service.
So the reverse must be true.
Be great, but be great EVERY DAY.
-THAT Planning Guy
Replenishment Failure
My Starbucks ran out of stoppers this morning. The stupid green stick that keeps my coffee from spilling all over my car. Wow.
Is it hard to keep in stock of an item that you give away?
Demand= cups X ratio, where cups = sales fcst X (% hot beverages to sales)
Ratio = average #stoppers given/cups used.
If you know the sales fcst, which I bet they do as they likely use for labor fcst the rest is MATH:
Assume sales is 100, 000 for a month. (no idea, made that up)
70% are hot beverages with a price of 4.00. Half of people ask for stoppers.
Demand =((100000 X 70%) /4. 00) X 1/3. =8750 stoppers needed. Build in some safety stock to account for lead times.
Now I have to clean coffee off my car seat because someone failed at replenishment.
@starbucks – no charge for this demand forecast lesson.
-THAT Planning Guy
Relationships
Building a relationship takes a huge amount of time and effort no matter what part of your life. Girlfriend, wife, child, friend are all difficult enough to manage.
Work relationships are also a challenge. NO, not the Demi Moore “Disclosure” kind of issues… The productive work relationship, especially from a Planner.
In Maslow’s Hierarchy of Needs, you move up from Physiological through love eventually to self actualization.
Planning relationships go from:
KNOW : I know that person. Email relationship or phone call.
LIKE: yeah, she always gives me reports and important data.
UNDERSTAND: I see your perspective and know why you think I need to markdown, or order less. But I may not AGREE or execute.
TRUST: I believe you. I will cut receipts and it won’t effect sales.
When you reach the level of trust, the partnership can flourish. Until then, it’s generally one sided.
How do we get there? That’s another article entirely.
To be continued…
-THAT Planning Guy