Pricing Strategy

My usual grocery store sells my favorite energy drink as $2.50 each.  A 4 pack is $7.99. 8 pack is $14.99

This week’s  sale (and often is) was 2/$3.00. Isn’t the idea of promotions to drive SOME form of incremental gains? This promotion drove down both units and basket size.  Nice.

I wise man said  “we all know only 50% of promotions work, but we don’t know which 50%.”  (Wise is a gross understatement, by the way. Possibly one of the smartest people in the universe, and a Chief Science Officer of a company just full of genius-level scientists)

So to my grocery friends- if you would like to run your promotion ideas past me, I would be happy to vet them and crunch the #’s for you in my spare time.  Stop doing things that throw away money. Just stop.

To the rest of you, another good quote from the week:  Never miss the opportunity to take advantage of a crisis.  When someone leaves money on the floor, be sure to pick it up.

I love the smell of money in the morning.

-That Planning Guy

Planning, Pricing, Purchasing, OH MY!

A few disconnected situations floated by me this week, and of course That Planning Guy has to make the connections.  Nothing is truly random.  (Old Dilbert joke about an accounting Troll, generating random #’s… he is yelling 7,7,7,7,7,7,7.. Dilbert asks “Is that random? How can we really know?”)

First, someone commented about how strong the demand was for advanced Planning and Assortment tools in the marketplace today.  Very true: I have preached for years, it all starts with great planning. Planning drives assortment. Assortment drives replenishment.  Replenishment removes stock outages. Throw in good product, of course – and the right product, at the right time, in the right amounts makes money. The consolidation in software makes everything both very specialized and homogenized.  Hard to differentiate one great tool from the next, without a DEEP understanding of what the tool brings. Feature-Advantage-Benefit. “How does THAT help me” is the question I often ask.

Next, someone else commented about a price of water on their vacation being MUCH lower than they could have (a large bottle of premium-brand water for $4.50 in Cayman?? That’s just crazy talk. Piled of money laying on the floor.) Clearly whoever determines that price is not listening to the demand signals, and pricing based on a perceived IMU goal.  If the water was $4.95, would the guest even NOTICE, let alone care? No, and we all know that is true.  But your P&L would certainly notice the 10% profit flow-through boost.

Last, a guest service ‘situation’ came up, and I don’t often get to be involved.  A group of College students are coming to town to attend a large Apparel show, as they are in a merchandising-related major.  I spoke to the students last year who came, and I had a really good time. This year, they moved from a competitor’s hotel to one of ours and I helped them arrange it.  They made some # kids to room changes to be able to afford the new luxury hotel, and I appreciated that they preferred to stay in ‘our house.’ Long story, there was some mix up in the reservations, and they needed an accommodation added to the rooms that was not normally included, and reached out to me to see if I could help.  They were literally at the peak of their budget already by staying in a great resort. So I reached out to a partner at the property, and he reached out to one of his partners, and within a day, we had resolved this issue.  It cost the company ZERO to solve this problem.  What did we gain? This group will now stay here every year, hopefully forever.  The rooms and resort are beautiful, so 30 people per year, 10 years, that’s 300 new loyal customers.  AND— since College kids, I would assume they are all Social-Media fiends, as my college-age daughter is, so likely have 1000’s of connections.  This simple act may have changed the perception of tens of thousands of customers over time. 

So where is the correlation?  Listening to the customer, and not just superficially.  What are they saying, but what are they SAYING.  Spend patterns, buy patterns, hotel reviews, restaurant surveys, Yelp, FB and Insta, survey monkey, and simply asking the question – all these tell a story if you are reading it correctly. BIG picture, connect the dots.

And to react to it properly, you need to not just hear it, but understand it, internalize it, draw insights, and react to it – all in near-real time.

Right product+ Right time+ Right amount+ Right price = Right Profits.  Any of these fail, and the chain is broken.

#AnalyticsDrivesBusiness.

Aloha Friday, fellow #datanerds

-That Planning Guy

Markdown is not a dirty word

The last few weeks have been a blur of travel. Mostly work, some personal (Parents weekend!) Lots of lessons, and lots of opportunity to learn.  And now finally time to look back and make some sense, and try to put the pieces together.

First trip was to a Revionics Insight conference.  A great conference as always, but this year was especially interesting to me as we are ‘seasoned’ in base and optimization, and piloting a markdown. ( And I always enjoy when my team gets recognized as industry leaders by their peers as well, so an award was cool to receive as well)

Listening to the vendor, other progressive retailers, and some genius data science people (and there were a lot running around in one place), I had an epiphany that the way we handle MD is really wrong. It should not be an ‘event’, but an ongoing process.  And the way we have viewed these as a negative is also a little backwards.
Who said a discounted item has to be bad? We should be smarter. so here are That Planning Guys Super Secret Markdown Money Making Methods!
First: Lets not call them markdowns or ‘clearance’ or even discounted.  Lets call the items being ‘promoted’  Great positive word. Who doesn’t want a promotion?
Next, stop filtering out goods or vendors based on an opinion of the goods. Words like ‘Basic’, ‘core’, ‘current’ really are hurting the process. I want to take all items to evaluate effectively as groupings (or clusters, but more on that at a different time)
Lets spread the time frame of the promotion goods. They don’t need to be gone in 6 weeks… lets make it a process that can take time. The secret to making great food in a smoker is time and patience. A turkey takes 8-12 hours at low heat to be outstanding.   A markdown cycle may well be 8-12 weeks, but the results can be outstanding as well.
Let the optimization & analytics tell you what to do and when. Then the merchant decisions can factor in.  If the math says to promote (note: NOT MD!) an item, then the merchant can look to a RTV, stock balance,   or other means.  And if no means available, take the price change as prescribed.
In short… take all the goods that you have, and determine the exit date at the time of arrival, or even creation.  Evaluate as a whole group, whats the goals, whats the desired outcome?  Then let the math dictate the ‘smoke’.   Don’t get hung up on items considered ‘core’, as if the math says to promote, maybe they aren’t really meant to be core.

Selling items faster and more profitably do not have to be mutually exclusive goals.  If the goal is to liquidate fast, OK… But the goal should be to make money, more money, and lots of money.  Be smarter.

-That Planning Guy

PS- Next post will be talking about clustering and advanced analytics, another fun conversation from my travels.

Pricing Analytics in an F&B Environment

I have been thinking more and more about the pricing analytics that we are applying with great success in Retail and how it can be applied to a restaurant environment.   An item sold has similar attributes attached of location, unit, retail, and COGS. Why is it relevant that it’s a store? Couldn’t it just as easily be a restaurant or a bar?  In fact, the cross-brand analytics might even be more compelling.  Isn’t a Bud draft a Bud draft? Or soup a soup? (Varying costs, but like-for-like probably close?)  I will speculate below.

Lets get mathy, my fellow #datanerds!

Say a Miller draft costs $1.00 and sells for $5.00 in your restaurant.  (I made that up, of course. I would hope the cost is lower, but I don’t know so I like a round number.) You are selling 100 per day at this price.

What’s the break point of different elasticity?  How much can we drop units at each price point and grow profit, and hopefully revenue as well?

grop3


To me, the safest bet above is the $5.50 test.  The most likely outcome is the scenario #2, which is  .9 elasticity, resulting in a slight revenue pick up, but a 2.4% profit increase.

Couldn’t this apply just as easily to food? My first inclination is to test deserts. But conversely, I am thinking about a lower price to drive units (I know… that’s where my head is too.)  Let’s assume a cannoli costs $2.00 and retails for $7.00.  What scenario and grid would be the likely outcome?

grp33.png

Again, the pricing signal, with all things being true, would point to a $6.00 price test, and likely the middle scenario: +$28 topline, $12 bottom line. And, 8 happier people.

IF.. and it is a big if.. we could raise a beer, and lower a desert, resulting in a higher total check and increase profit, that’s win- win.   Also, higher cover means higher tips, so happier servers. Win-Win-Win.

In the food space, I would be really curious to apply t0 an add-on menu: Adding items to a pizza costs $2.00, adding cheese to a burger is $1.00, adding a side of turkey bacon to breakfast is $4.00 and so on.  I’d love to see how these pencil out in real-time, both up and down.  How elastic are add-ons? Maybe a 3/$5 deal on a pizza? It seems like add-ons are zero ‘overhead’ and are true incremental pick up -minus COGS of course which I suspect are low, considering.  A slice of cheese for a dollar- that has to be 90+margin. These seem like huge margin drivers….Shouldn’t we be maximize units? (and creating the perception of value?)

Once we can apply this to a bigger scale, and have a few thousand data points to determine best outcomes, the math – and break point- should become self-evident. They  likely vary by location, by region, by geography.   And numbers don’t lie.  I imagine in a large-scale F&B environment the math should justify whatever price-management tools are needed.  BWW? Applebees? Chilis?  Even the neighborhood pizza place.

Analytics Drives Business.

-That Planning Guy

PS- A beer and a cannoli for dinner? Hope there is a calzone in between!

Pricing analytics, revisited

I commented this week that if an item sells really well,  it is probably priced too low.   The reverse is also true.  There are no bad products,  only products priced wrong!
Is this really true? 

Part 1: if an item sells better than expected,  the perceived value is bigger than expected,  which should show in the pricing analytics.  Demand > expected demand is a pricing signal… Giving away profit. (assuming of course elasticity supports this,  and new retail X lower units is better than old lower retail X original units.) If not true, then the signal is wrong.
What about the reverse,  the part 2? If an item sells worse than expected,  can’t we just lower the price until demand is where it should be? Hmmm.   Unless it is not profitable,  in which case it was a bad product,  bad timing,  bad presentation even- and pricing is not the (only) issue. 
When you run out of pretty,  ugly sells?
But, how do you know what the right price is  to start?  What if your comparison items are wrong too? Comparing to competitors?  We KNOW we are smarter than those guys!

Perception.   Where is day 1,  and where will day 2 end? The route to success can not be short-cut.

Note: Athena was the Greek Goddess of wisdom,  justice, math… and war.   Is the connection that direct between wisdom and war? Perhaps the natural order, linear context,  direct path … Next,  let’s look at some SunTzu – Art of War. Always some fun things to discuss.
-That Planning Guy

Pricing Elasticity 101

Price elasticity is a wonderful equation.  When you Google it, you get a lot of equations that look like this:

E_d = \frac{\frac{P_1 + P_2}{2}}{\frac{Q_{d_1} + Q_{d_2}}{2}}\times\frac{\Delta Q_d}{\Delta P} = \frac{P_1 + P_2}{Q_{d_1} + Q_{d_2}}\times\frac{\Delta Q_d}{\Delta P}

Isn’t that the writing they found at Roswell, New Mexico on the Alien ships? I am also fairly sure I went to a party during my younger days at a house that had many of those symbols over the door. But that’s a different story.

To be honest, I think that might be way over complicating the simple idea of elasticity.


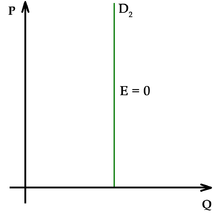
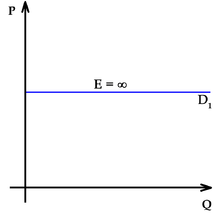
So much easier to think of it this way— if you think of elasticity in between these 2  graphs, all pricing should fall in there somewhere.

The simple math is if the price increase and unit fall behave in lockstep (or worse, units fall disproportionately to the price change), that’s elastic.  If the the units fall less than the price increase, that’s inelastic.  And that’s where the money lies.

Identifying these items is often difficult, as some degree of what-if has to take place. But in a perfect scenario and all other factors being equal,  if you raise price and units don’t fall (inelastic) then you make more profit.   If you raise prices and the unit fall % is greater than the increase in profit kept, your elasticity was too high, and you lost money.

The math is easy; the execution is what is actually much harder.  Consumer behavior is a fickle science, and small ripples cans make large waves.  If the consumers feel the price is too high for the situation (whatever that may be) they will not shop.  This applies to a grocery store, a web site, any transaction-based environment.

My concern is if the unit loss leads to intangible losses: What are the ‘pull items’ from a basket analysis that also may fall, with the law of unintended consequences rearing its ugly head.  If you raise cigarettes, and you gain extra money but lose units, and the change proves to be inelastic, that’s great! Units fell 2%, and transactions fell 2% but revenue and profit up 5%.  BUT- before you pat yourself, what about the sales WITH the cigarettes- Lighters? Gum/mints? Any change to behavior in these? Whats the avg UPT of a transaction involving the item. If the add-on item is not impacted greatly, or the net is still positive, that’s a winner.  The point is to look outside the box to be sure you are right and not just do analysis in a vacuum.   If the results of the total store, and the total transactions, and the total profit is increased, then the move was genius. Someone once said “Analytics Drives Business.” Enjoy the fruits of this! And then find the next inelastic item to glean profit from.  They are out there, filling your shelves, your website, your stock rooms.
Too low, too high, Goldilocks pricing?

Retail is an imperfect circle. Remember your 3 R’s- Right product, Right time, Right price- and all 3 factors are critical.  A great product late is no better than a bad product, and a incorrectly priced item negates the first 2 every time.

-THAT Planning Guy

 by


Disney Dynamic Pricing?

If anyone hasn’t heard yet, the new Disney pricing strategy started today. I have to say I am shocked more people haven’t been shocked by this. imagine, pricing being reflective of demand? Who’s next, airlines, hotels, movie theaters?  All already doing. Restaurants? Do you think the lunch portion is REALLY that different?

The questions is, who isn’t doing some degree of dynamic pricing.  Everyone should.    Demand, in its simplest, is what a customer will pay.

Applaud their innovation.
Forbes article here: LINK